Many companies have large collection of data and valuable information is constantly flowing in and out of the organisations. However, there needs to be a way to both collect and make sense of those data. Big data analysis has become an integral part of business intelligence because it provides in-depth insights of company's performance from business development to technical operations.
Through data visualisation techniques, we can repurpose complex facts and figures into visually intriguing images and concepts for the less technical teams or for the management, and communicate key information across quickly and more efficiently, before the next steps of data analysis and application.
What is Data Visualisation?
Before going into data application, we need to first explain what data visualisation actually is. Data visualisation is when data patterns and trends are repurposed into a visual format. The purpose of visualisation is to present complex information in an easy-to-read format. For instance, in an organisation, complex data from sales revenue/ profit anaylsis, project management, employee attrition,supply chain management, marketing leads trends, can be all expressed visually with charts and graphs.
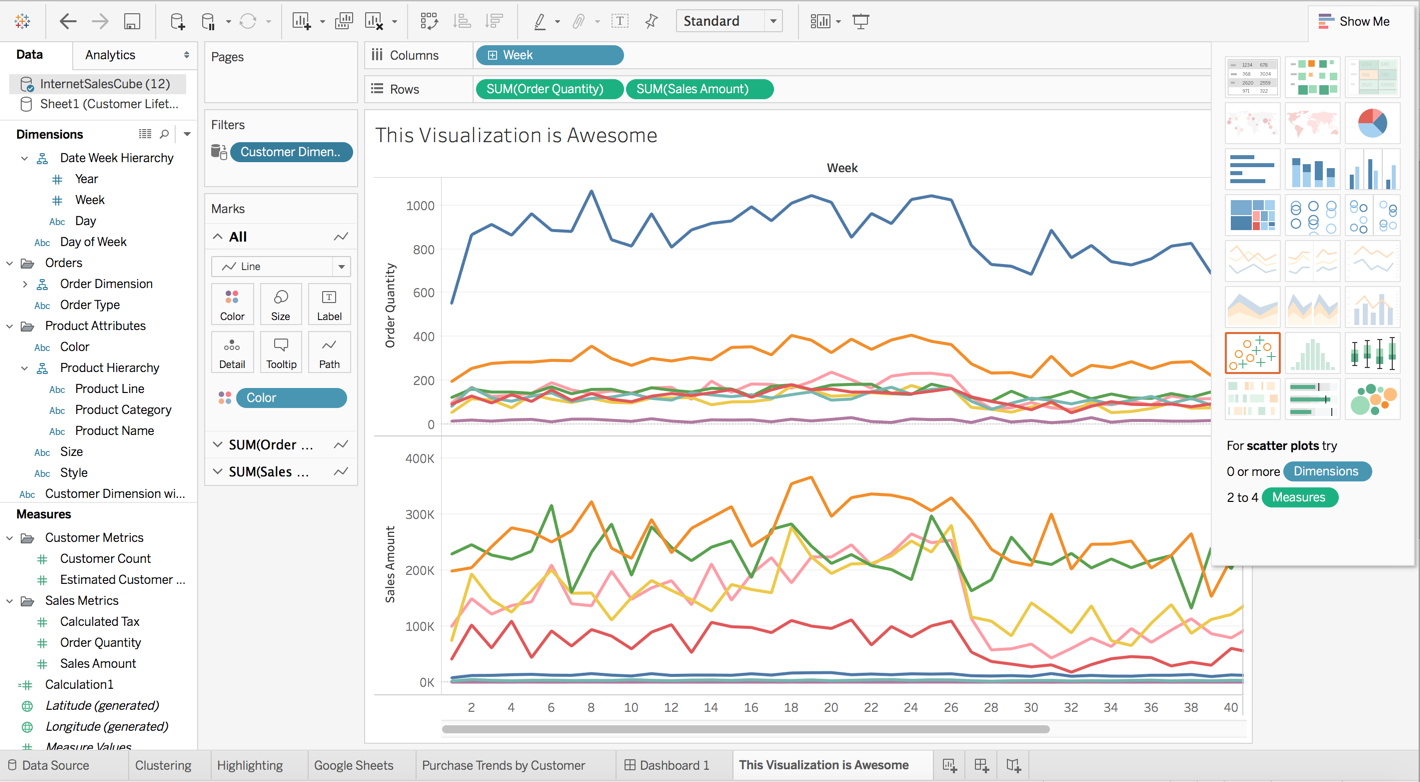
The visual format usually takes the form of conventional diagrams like graphs, and treemaps. However, data visualisation can also incorporate 3D elements, which opens up options for presentation. For example, the Washington Post wanted to show the spread of the eclipse. To show the eclipse’s path, they used a spinning globe to show how the sun’s rays spread from the west coast to the east. Data visualisation is a huge asset for companies because it becomes easier to discover trends and patterns in data.
What is Data Application?
Data application is the point where end-users, whether it is consumers or business executives, interact with data and develop exceution plans. It builds on what data visualisation started to make big data more interactive and accessible than before.
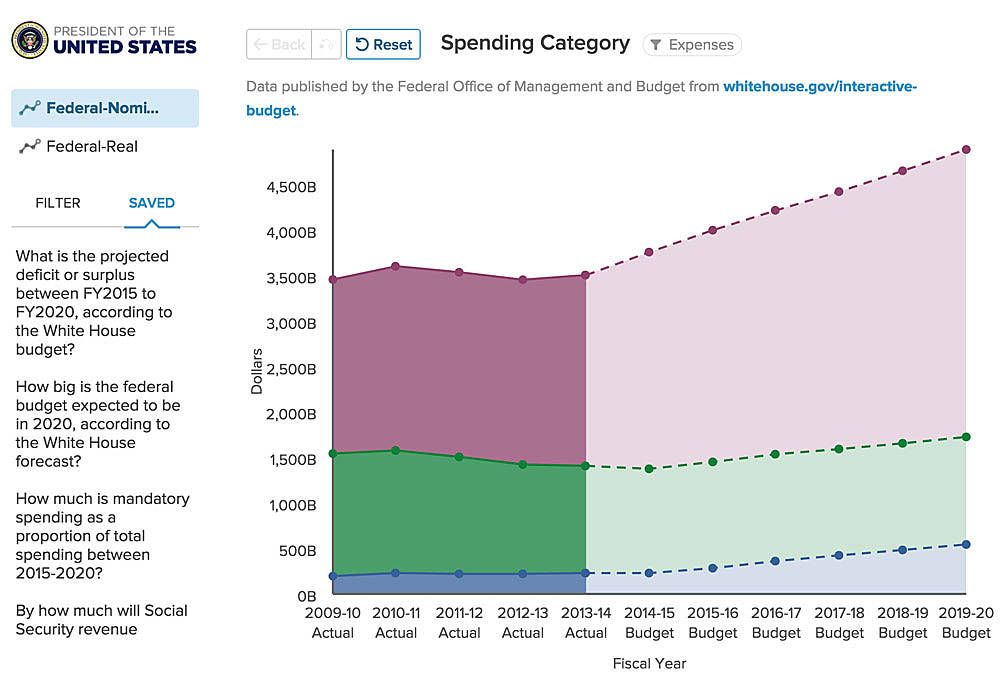
An excellent example is the 2016 White House budget. The Obama administration wanted to explain to taxpayers how their money was channelled into different services, so they presented the data in the form of an interactive treemap, making it easier to digest complex information. End-users are encouraged to interact with big data to explore facets of knowledge and discover new information.
Why is Data Application More Valuable Than Data Visualisation?
Strong Interactive Element
There is a strong case to make that data application is more valuable than visualisation because it increases data utility and improves business strategy formation. Data application allows end users to interact with data, while data visualisation is static. The interactive element improves data utilisation because users have a much easier time understanding concepts and findings, which aids in business strategy formation. Data visualisation lacks context and is prone to misinterpretation, but data application is tied directly to real-life cases making it much easier to interpret data correctly.
Data Application for Storytelling
Data application challenges data scientists to be more creative when presenting their data findings. An excellent example is data storytelling, a technique that encourages researchers to present their findings in a narrative, instead of visual form. Data storytelling has many advantages over data visualisation. End-users respond better to stories and easily recall facts and figures when presented in a story format. Executives, clients and people who may not understand complex data will have an easier time understanding these insights, making business planning much easier.
Data Application and its Growing Value
Data visualisation has been valuable in presenting findings in an easily digestible manner. However, as companies become more dependent on data, presentation techniques have to evolve, increasing end-user engagement. Hence, data visualisation must give way to data application. Data application comes with all the benefits of data visualisation, but with an interactive element that makes it much easier to process complex data. With data application, companies can process information faster, allowing them to act on their findings sooner, and fostering a competitive advantage over their peers.
